Kicking Off the Third Annual Put Us on the Map Challenge
Feb. 1, 2024
Caleigh Paster
Here at the Dashboard, we believe that data is a key component to driving change within communities. Whether to spotlight successes or help uncover challenges, having access to data is one of the first steps to creating a healthier future. Since 2018, the City Health Dashboard has been working to provide communities, both big and small, with data on health and its drivers, to support their change-making efforts. We strive to remain a reliable and accurate free source of data for cities across the country.
As part of our continued work towards this mission and to grow the impact of the Dashboard nationwide, we launched the Put Us on the Map challenge in 2022. This initiative is an opportunity for smaller cities to apply to get their city on the map and to date, has helped us add 96 cities from across the country to the Dashboard. Last year, we shared how some of these small cities are already using their data to make an impact and improve city-wide health.
Announcing the 2024 Put Us on the Map Challenge
We are excited to announce that the Dashboard is now accepting applications for the third annual Put Us on the Map Challenge! For cities with less than 50,000 population, this is an opportunity to get free access to the Dashboard, its features, and data on up to 30 metrics on health and the social determinants of health.

The application period will close on Friday, March 1st at 5pm EST.
Ready to apply? We’ve outlined the application process below, from eligibility and selection criteria to a detailed timeline of the 2023 Challenge.
Who can apply?
Anyone representing a small city, including individuals or partnerships, can submit an application. Please review the selection and eligibility criteria before applying.
U.S. municipalities, including cities, towns, townships, boroughs, and villages with populations between 1,000 and 50,000 can apply.
Individuals or teams represented by community members, policymakers, city government leaders and staff, students/student groups, teachers, and others are encouraged to apply. Partnerships showing existing cross-sector collaboration are a bonus.
If the applicant is not from city government, please include a letter of support from a partner within a city department. A template letter is provided here.
Please note that multiple requests for the same city will not improve your chances of being selected. If there are multiple groups from the same city interested in getting their city on the map, we encourage demonstrating this collaborative interest in one joint application, emphasizing how the data will help multiple stakeholders.
If you are eligible to apply based on the above criteria, the application requires you to share why local data is important to your city, what you hope to accomplish with the data, and how data will make a difference in the health of your community. The responses to these three questions are the most important component of your application.

What are the benefits of joining the Dashboard?
Access to your city’s data on the City Health Dashboard, including up to 30 health metrics (listed below) as well as access to more metrics as they become available in the future
Cities will be able to use all the features of the Dashboard, including a comparison tool to gauge health across cities, a curated list of Take Action resources, and more.
Support from the City Health Dashboard team to help you understand and leverage the data in your work.
A featured blog or Impact Story on the Dashboard, highlighting how health data makes a difference in your city.
Explore these small city examples from our blog and Impact Stories.
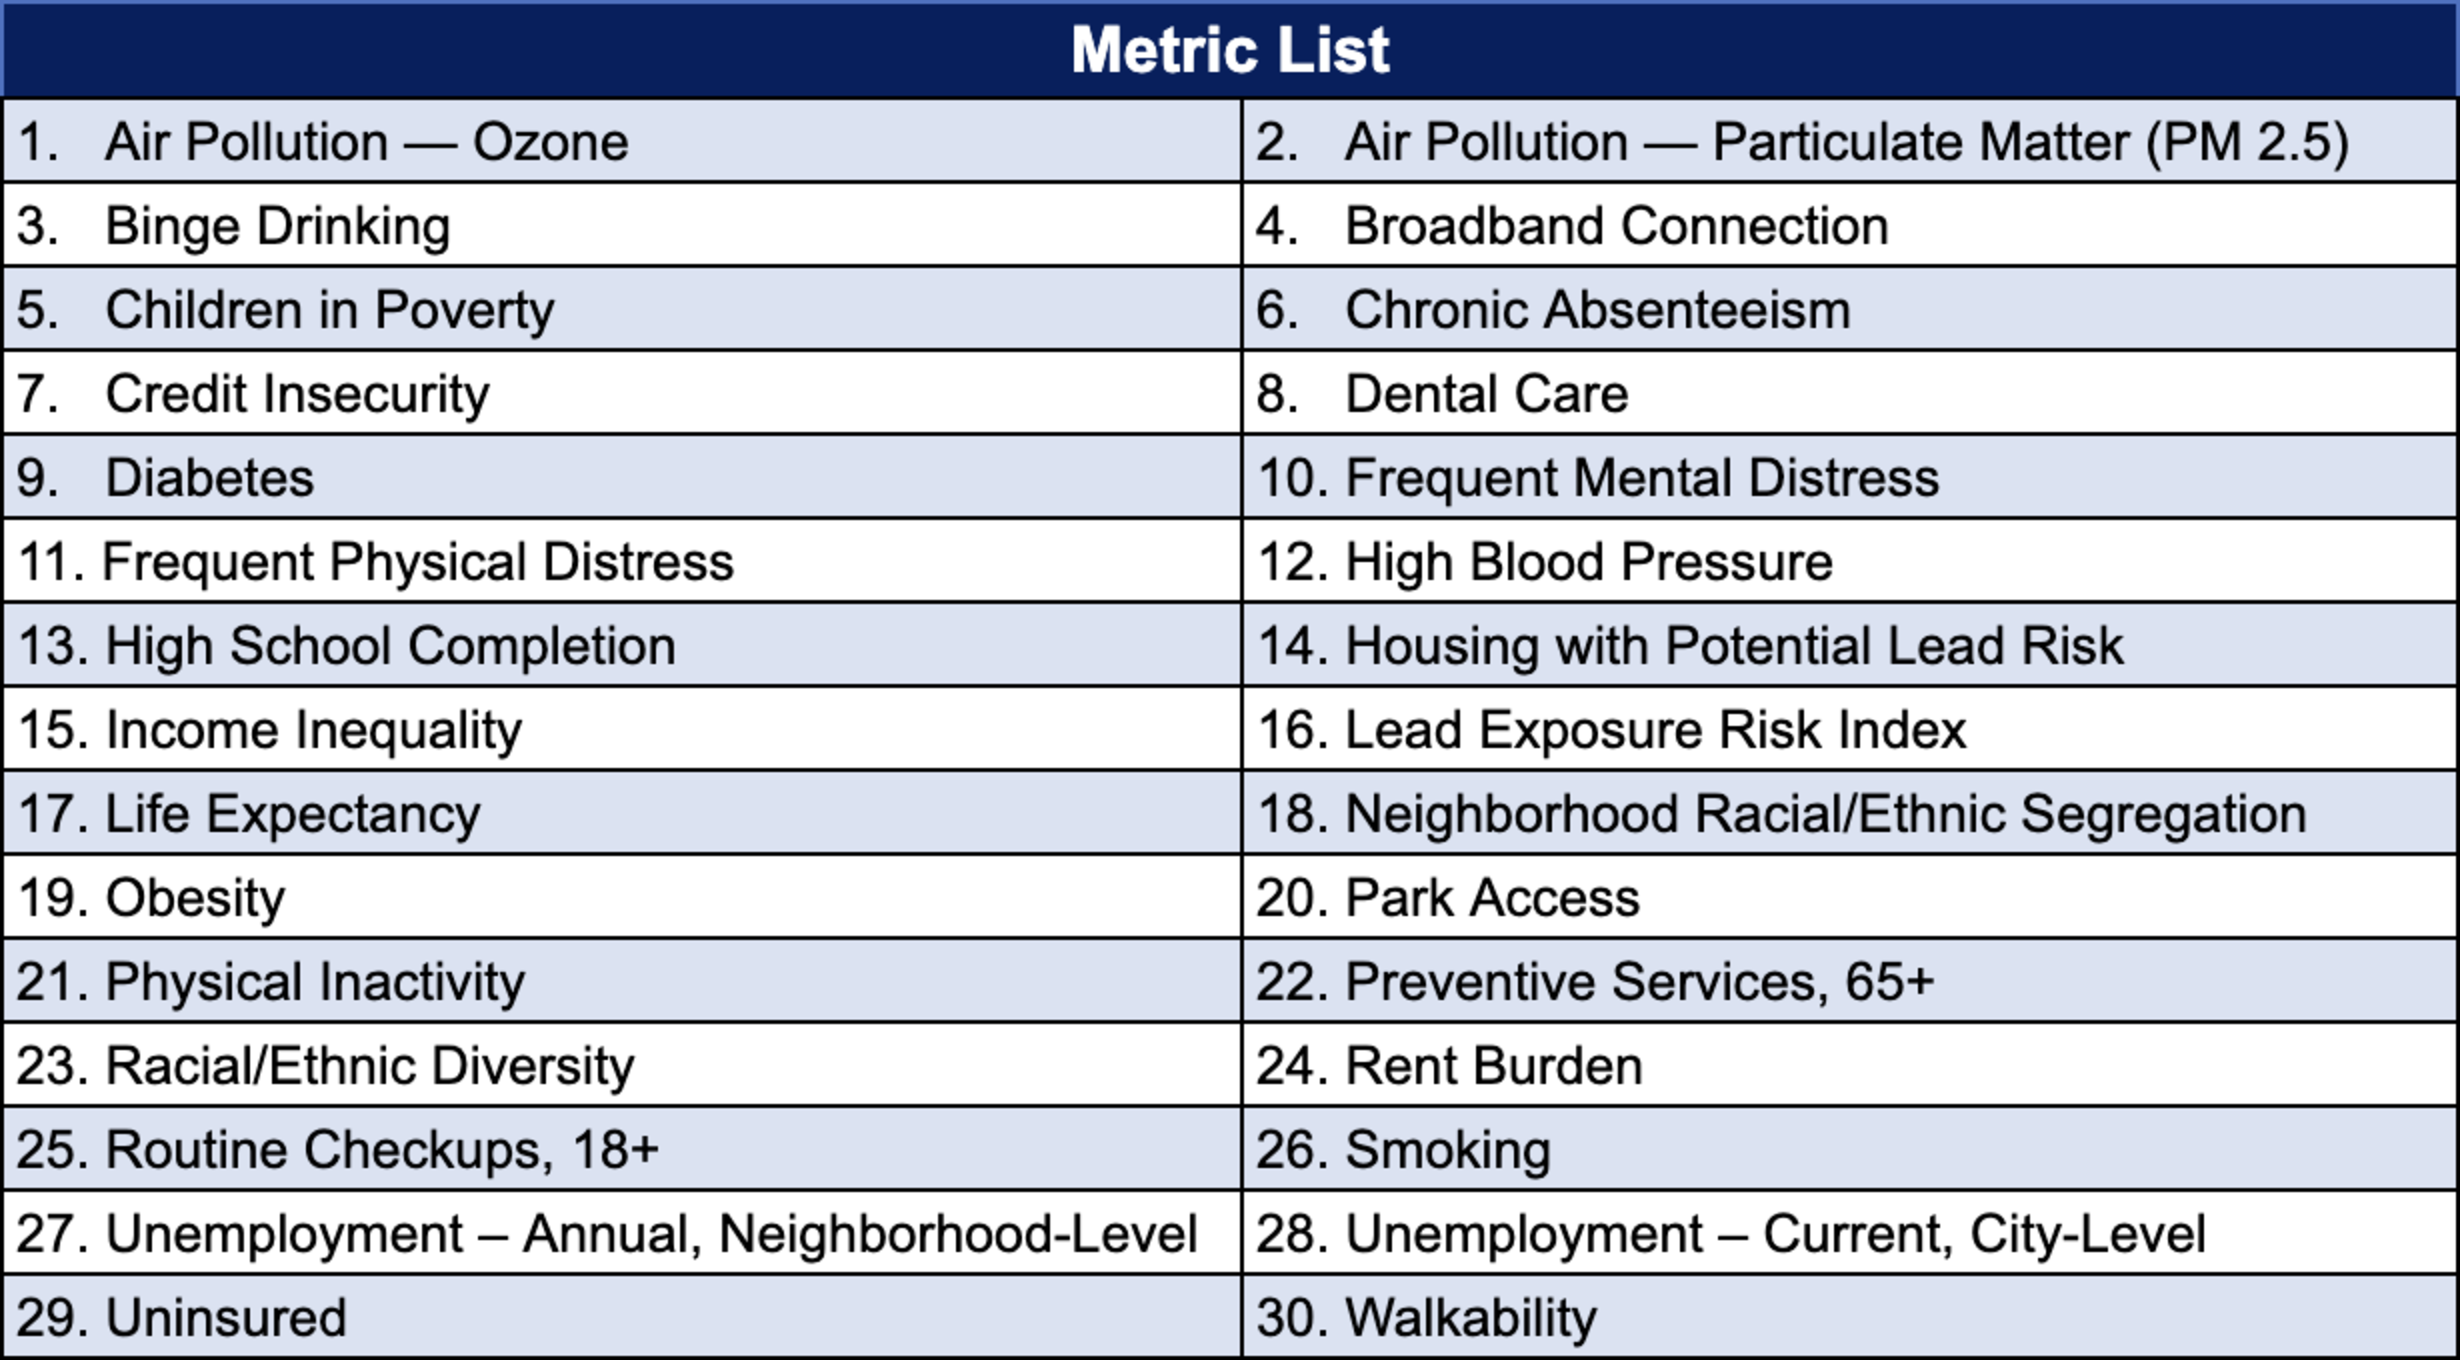
The Dashboard strives to supply as many metrics as possible for our cities. However, many communities with a population less than 50,000 have limited data availability. Therefore, we can only guarantee a subset of the Dashboard’s metrics for the selected cities at the time of the summer launch. Once a city has been selected for the Dashboard, they will be included in site updates and new metric launches. For this year’s challenge, we will be able to present the most recent year of data for the following metrics for all selected cities:

Challenge Timeline
Applications will close on Friday, March 1st, 2024 at 5pm EST.
Selected cities will be notified this spring, with cities launching on the City Health Dashboard in the summer. After the new cities have been added to the site, the Dashboard team will host a special Virtual Office Hours to support navigating the site and putting the data into action. The Dashboard team will remain available for cities as they use the data and resources to create change in their communities.
Our hope is that cities of all sizes can use our data to empower local leaders and inspire solutions to improve health and equity. Don’t miss out on gaining valuable public access to neighborhood-level data on health and its drivers for your community. Apply now to put your city on the map.
Please reach out to Caleigh Paster, [email protected], if you have any questions.